Wednesday, July 21, 2021
2Q21 Boulder County Stats
Monday, July 5, 2021
Broomfield Heights 1st Filing 2Q21 Stats
Are we returning to a more normal real estate schedule? Last year, nothing was normal. Like everyone else, we were completely shut down for a few weeks. When things started going again they didn't slow down, not even very much in July and during the holidays.
This summer we're seeing the typical slump in showing activity while people head out on vacation, excited to be out in the world again. We are still low on inventory, and properties under $600,000 are still moving quickly.
Broomfield Heights 1st Filing saw 15 houses close in the second quarter, keeping pace with last year and exceeding the three years prior.
The median $/sqft foot dropped slightly, but I'm not very concerned about that being a trend. That number moves from month to month depending on what is on the market. Also, I noticed more houses than usual in the neighborhood were sold off-market, at least one to a family member at a steep discount. Houses that don't make it to the MLS generally sell for less than they would have had they been given adequate market exposure and had a real estate expert negotiating and advocating for the seller's needs. If you'd like a Comparative Market Analysis of your home, contact me anytime, no obligation!
Thursday, May 13, 2021
April 2021 Boulder County Stats
We continue to speed along the real estate highway, stopping to catch our breathe and grab an occasional smoothie.
If you need more specific sales data for your neighborhood or your home, please contact me for your no-obligation Opinion of Value.
Monday, April 12, 2021
Boulder County March Stats
All I have to say is - Sellers, what are you waiting for? We have a national housing shortage, and the data is backing up all of the stories I keep hearing from colleagues.
Monday, February 15, 2021
Boulder County January Statistics
The trends from 2020 continue. The number of total active listings (detached single family homes) is down significantly from this time last year, almost 36%. Correspondingly, the average market time is down over 27% as buyer demand remains high. Average and median sales price continues to go up as buyers compete for the homes for sale.
Tuesday, January 19, 2021
2020 Boulder County Statistics
Tuesday, July 14, 2020
Boulder County 2Q20 Stats
Monday, July 6, 2020
Broomfield Heights 2Q20 Stats
However, our $/sqft slid more than 6% from this time last year. This could be partly due to more than 40% of the properties being sold off market, or not in the Multiple Listing Service. A couple of those were severely under typical market value. This lack of exposure to the general market can result in a seller leaving money on the table.
Of course, we don't know all of the factors - perhaps there were structural or other large issues that necessitated a discount, or one family member was selling to another at an intentionally lower price. But without this information, these kinds of sales can affect appraisals and neighborhood appreciation trends. If you'd like a free evaluation of your home, don't hesitate to reach out!
Monday, May 18, 2020
COVID-19 Affects on Boulder County Real Estate
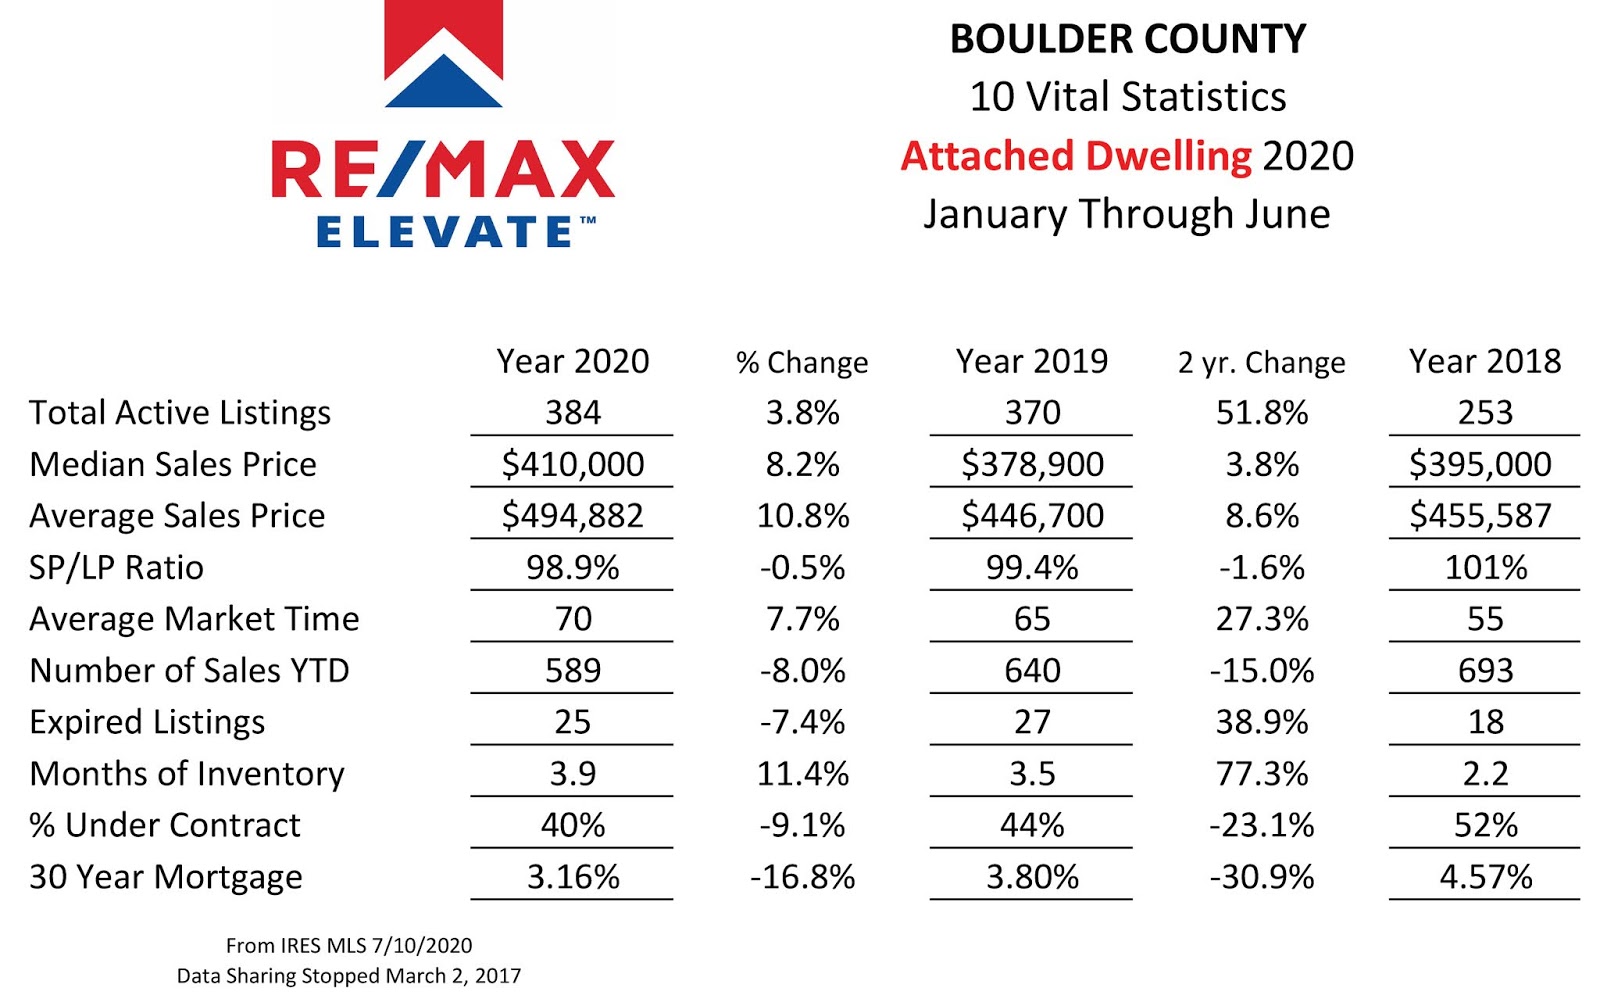
As of May 9, in-person showings were allowed again, although open houses are still forbidden. You can see the affect on the active listings total in Boulder County, down for both detached single family homes and attached townhouses and condos. Months of inventory are also down since this period last year, which means that for the buyers that are still out there looking, pickins' are slim and bidding wars are still occurring for prime properties.
Prices in the Boulder Valley have been holding so far. Since the pause in activity was not caused by anything in the housing industry, sellers still want the prices they were seeing before the stay-at-home order. And to a large degree they are getting them. Investors may see some opportunities where others are having difficulty, like AirBNB properties. Interest rates should hold steady this year, and listings are beginning to increase. Get your financial ducks in a row - when that perfect property comes across your app, you'll want to be ready to move quickly!
Monday, April 27, 2020
Boulder County 1Q20
![]() |
| March showings are just above the 7-year low |
![]() |
| First quarter was promising another busy spring |
Despite showings only being allowed virtually, houses at the entry level under $450,000 are still seeing a lot of interest. My listing in north Westminster got 3 offers in 2 days before anyone had even set foot in the property. Pent-up buyer demand seems to indicate that our busy spring season will be pushed to late summer. If you have any questions about how to navigate this odd market, don't hesitate to reach out!
Friday, March 13, 2020
Broomfield Heights Market Pulse
Those who are trying to become homeowners can purchase a fixer-upper in Broomfield Heights with good bones for the mid-$300s and live in the desirable Boulder Valley School District. Broomfield also makes open space preservation a priority, and the trail connectivity throughout the area and into other cities is invaluable.
This March we are seeing multiple-offer situations again, with buyers waiving contract contingencies to make their offers more competitive. Buyers need to have started the pre-qualification process with their lender and review the contracts with their Realtor so they are ready to move quickly when the right property pops up.
You can see the seasonal cycles in the chart above, where sales go down in the winter and increase in the spring and summer. Property moves all year, as people still need to move for reasons they can't control. Properties that are in good shape and priced appropriately will sell during any month, so if an agent tells you they can't sell in the winter, move on!
Friday, January 24, 2020
2019 Boulder County Market Data
Drill down to just the past year to see the inventory at all of the price ranges. The glut of the properties sit between $350,000 - $700,000. It was also clearly a seller's market with 1-3 months of inventory, except for luxury homes over $2,000,000. A balanced market is typically 4-6 months of inventory, which we haven't seen in most Denver metro markets since the recession.
I rely on stats to confirm my gut - there's no substitute for actually getting into houses and knowing the market one works in. Being part of a large brokerage firm and hearing my colleagues' experiences gives me a hyper-local perspective. I know which areas are still seeing higher appreciation and which would be the most vulnerable in a recession, which would be most affected by new oil and gas rules and which have strict building codes. And if you ask a question I can't answer I have 120 other agents to talk with. Let me know if I can send you any additional information!
Friday, February 10, 2017
Bradburn Village Update
2016 saw the typical slower start with busy spring and summer seasons. Sales were still going strong into the fourth quarter, echoing the continuing narrative from surrounding areas - high buyer demand, low inventory. Total yearly sales made 2016 the third highest in 9 years.
You can see in the chart below that, although a few sales this way or that way can really change the $/sqft average in any quarter, the trend lines for both attached and detached dwellings are on a healthy upward run.
Friday, October 4, 2013
A Look at Dutch Creek
![]() |
| The Dutch Creek Neighborhood |
This year, only 7 properties have been marketed through the MLS, and none of those have had to be withdrawn or expired. Sales prices ranged from $298,500 for 1256sqft to $360,000 for 2016sqft. The average days to offer was 10, and, on average, the homes that have closed already did so for 100% of the asking price due to the amount of buyer competition. The market has cooled a little bit, but with only one Dutch Creek home currently available and already under contract, any seller thinking about listing his home should still find himself in a good market position. If you'd like a free market analysis on your home to see if now is the time to sell, don't hesitate to contact me.
Friday, August 9, 2013
The Real Estate Wonk Bonk
STATEWIDE:
- Number of sales (detached and attached homes) rose to 28,068, an increase of 16% over 2Q12. YTD sales increased just under 17% compared to the same timeframe in 2012.
- Number of new listings (detached and attached homes) rose to 42,348, an increase of 16% over 2Q12. New townhouse and condo listings were greater than detached home listings.
- Median sales price rose to $260,000 for detached homes and $170,000 for attached homes. This represents an 8% increase over 2Q12. Median sales price is not an average of all home sales prices but the middle point, which may not be a good representation of activity in a short timeframe.
- Days on the market decreased 25% for detached homes and 29% for attached homes. Ask your Realtor to do a little digging into TRUE days on market and days to offer, which can reveal a more accurate picture of any local market.
- Number of active listings on the market at the end of 2Q13 was 33,256. Looking at the days on market numbers, this represents a 4.6 month inventory for detached homes and a 4.1 month inventory for attached homes.
- All regions showed a decline in sales from banks and other mortgage lenders (foreclosures).
NORTHEAST REGION (Boulder, Larimer, Logan, Morgan, Weld):
- Number of sales (detached and attached homes) increased 16% over 2Q12. Attached home sales slightly outpaced detached home sales.
- Number of new listings (detached and attached homes) increased 15% over 2Q12.
- Median sales price rose 4% for detached homes and 9% for attached homes. Median sales price is not an average of all home sales prices but the middle point, which may not be a good representation of activity in a short timeframe.
- Days on the market decreased to 81 for both detached and attached homes, a 25% drop from 2Q12. Ask your Realtor to do a little digging into TRUE days on market and days to offer, which can reveal a more accurate picture of any local market.
- Number of active listings on the market at the end of 2Q13 was 6,000. Looking at the days on market numbers, this represents a 4-5 month supply.
METRO DENVER REGION (Adams, Arapahoe, Broomfield, Denver, Douglas, Jefferson):
- Sales of detached homes increased 3% while sales of attached homes increased more than 20% over 2Q12.
- Median sales price rose to $284,000 for detached homes and $164,000 for attached homes. Represents an 9% increase over 2Q12. Median sales price is not an average of all home sales prices but the middle point, which may not be a good representation of activity in a short timeframe.
- Days on the market decreased to 45 for both detached and attached homes. Ask your Realtor to do a little digging into TRUE days on market and days to offer, which can reveal a more accurate picture of any local market.
- Number of active listings on the market at the end of 2Q13 was 12,450. Looking at the days on market numbers, this represents roughly a 3 month supply.